The Fires
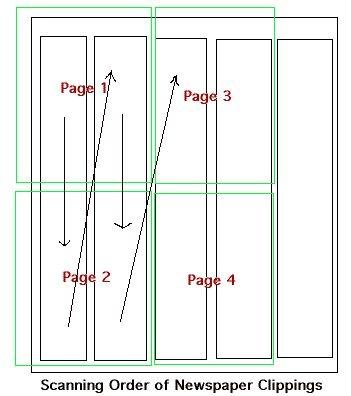
Due to the disparity in size between newspapers and computer screens, only a portion of a news page can be displayed at any one time. The illustration to the left shows how one full page of a newspaper is translated into computer pages. The black rectangles are print columns and the green squares are computer pages. When reading a story, it is neccesary to move from one computer display to another when reading down a column or from the bottom of one column to the top of another
 Scanning Order of Newspaper Clippings
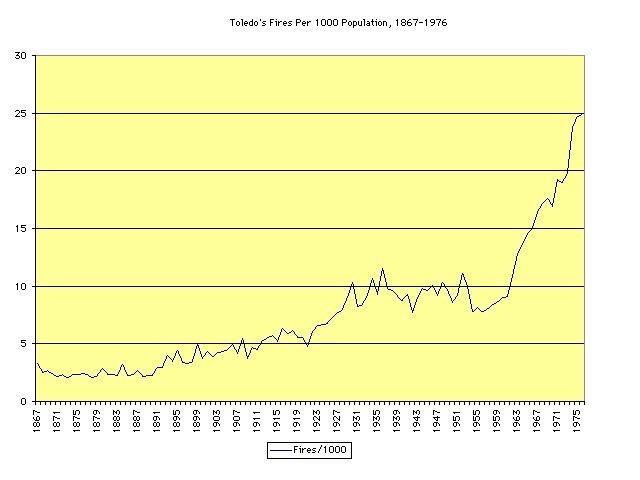
Graph of the Historical Change in Fire Frequency as a Ratio of Population, 1867-1976: Toledo Fire Graphs and Data
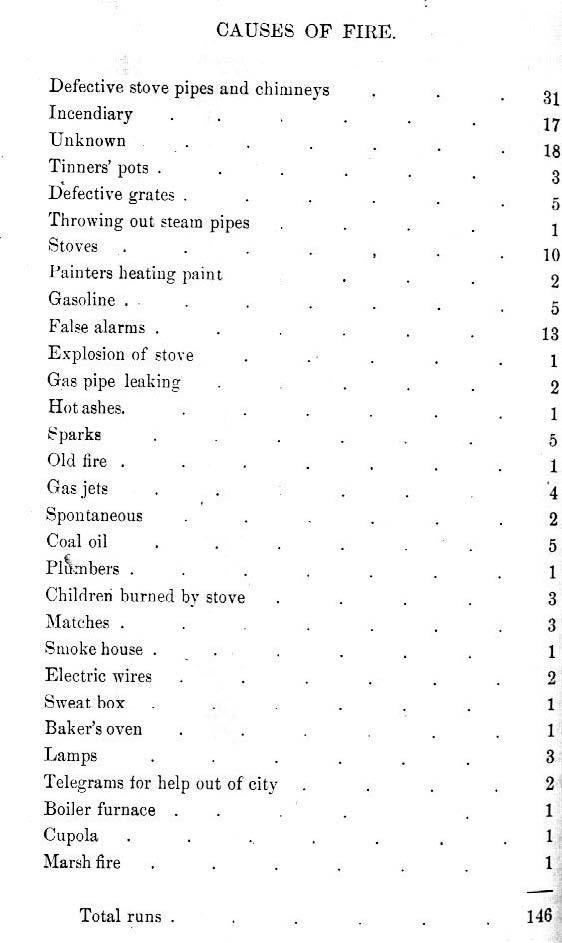
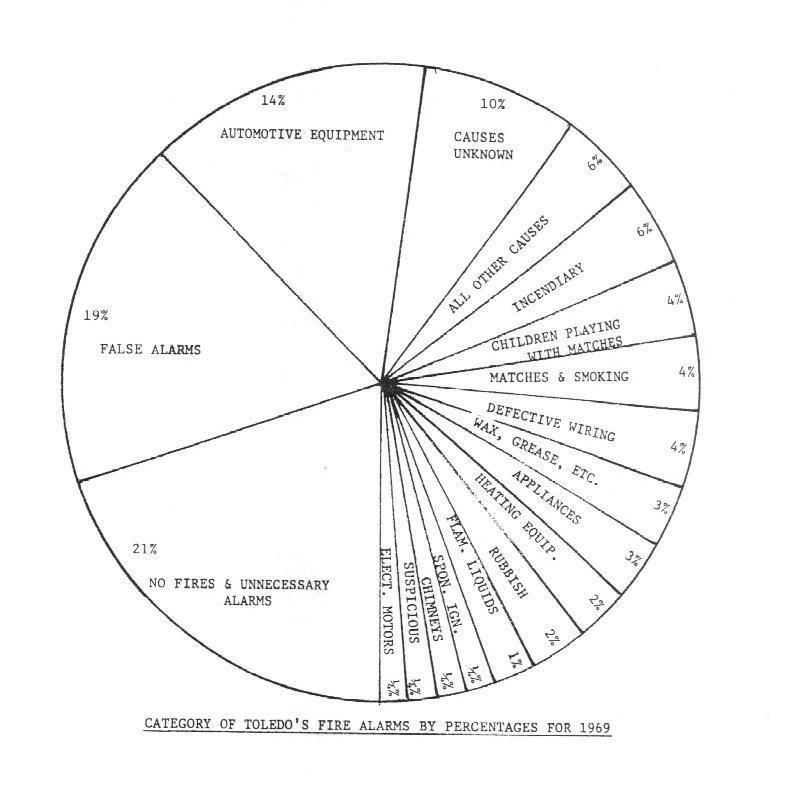
One of the consequences of industrial development has been a vast increase in the frequency of fires. The figures speak for themselves. As to the causes of this change, a general conclusion can be drawn from a comparison of listed causes of fires from 1885 and 1969:
 Causes of Fires in Toledo from the Report of the Fire Inspector, 1885.
 Category of Toledo's Fire Alarms by Percentages for 1969
 Toledo's Fires per 1,000 population, 1867-1976
